
Introduction
A Linux system is constantly running programs in the background.
From system services and daemons to shells and user applications, each running program needs CPU time, memory, and other system resources. Linux manages these running instances as processes.
Understanding processes is essential for anyone working with Linux infrastructure because many daily tasks—troubleshooting performance, managing services, investigating resource usage, and diagnosing failures—eventually require understanding what is running on the system and how it is behaving.
This post explores what a process is, how Linux identifies and manages processes, how processes relate to the system’s resources, and how to inspect them using common Linux tools.
What Is a Process?
A process is a running instance of a program.
A program is simply executable code stored on disk. When that program is started, the Linux kernel creates a process and provides it with the resources it needs to execute.
For example, when you run:
sleep 100the sleep program exists on disk, but while it is executing, Linux represents that running instance as a process.
The important distinction is:
A program is a file; a process is an executing instance of that program.
The same program can therefore have multiple processes running at the same time.
Process IDs (PIDs)
Every process on Linux has a unique Process ID, or PID.
You can see the PID of a running command with:
psA typical output might look like:
    PID TTY          TIME CMD
   4217 pts/0    00:00:00 zsh
   4382 pts/0    00:00:00 sleep
The PID allows the kernel and users to distinguish one process from another.
Many administrative operations use PIDs. For example:
kill 4382asks the kernel to send a terminate signal to the process with PID 4382.
The Process Tree
Processes do not exist independently. Most processes are created by another process, which establishes a parent-child relationship.
This creates a process tree.
You can inspect it with:
pstreeor:
ps --forestFor example:
systemd
├─ sshd
│  └─ sshd
│     └─ zsh
│        └─ sleep
├─ cron
└─ NetworkManager
This hierarchy is important because it helps explain how processes are started and how they are related.
PID 1: The First User-Space Process
After the Linux kernel finishes its early initialization, it starts the first user-space process.
On modern Linux distributions using systemd, this process is usually:
systemdand it normally has:
PID 1PID 1 has a special role in the system.
Among other responsibilities, it starts and manages system services and adopts orphaned processes.
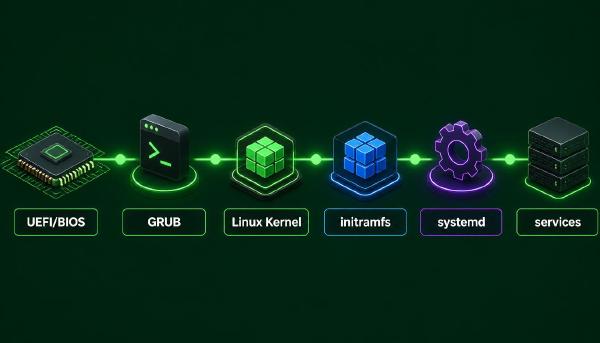
This connects directly to the previous post about the Linux boot process: after the kernel and early userspace initialization, the system eventually reaches the point where PID 1 takes over the management of the user-space environment.
Process States
A process is not always actively executing on the CPU.
Linux processes can exist in different states depending on what they are doing.
You can see process states using:
ps auxThe STAT column provides information about the process state.
Common states include:
R— Running or runnableS— Interruptible sleepD— Uninterruptible sleepT— StoppedZ— Zombie
For example, a process waiting for input or another event may spend most of its time sleeping rather than consuming CPU.
This is why a large number of processes does not necessarily mean that the system is under heavy load.
CPU Time and Scheduling
The CPU can execute only a limited number of instructions at any given moment.
Modern systems may have multiple CPU cores, but there are usually far more runnable processes than available CPU cores.
The Linux kernel therefore uses a scheduler to determine which runnable process gets CPU time.
Processes take turns running, creating the impression that many programs are executing simultaneously.
You can observe CPU-related information with:
topor:
htopThese tools show which processes are currently consuming CPU resources and help identify CPU-intensive workloads.
Memory and Processes
Processes also require memory.
A process has its own virtual address space, which allows it to work with memory without directly manipulating the physical memory of other processes.
Linux manages this virtual memory and maps it onto physical memory and, when necessary, other storage mechanisms such as swap.
To inspect memory usage from the command line:
free -hTo examine memory usage by individual processes:
ps auxor:
topA process consuming a large amount of memory may indicate a legitimate workload—or potentially a memory leak or misconfiguration.
Inspecting Processes with ps
The ps command provides a snapshot of currently running processes.
For a more complete view:
ps auxThis typically provides information such as:
- User
- PID
- CPU usage
- Memory usage
- Process state
- Start time
- Command
Another useful form is:
ps -efThe two formats are slightly different, but both are commonly used for process inspection.
For example, to find processes related to SSH:
ps aux | grep sshHowever, when possible, more specific tools such as:
pgrep sshcan be cleaner for identifying processes by name.
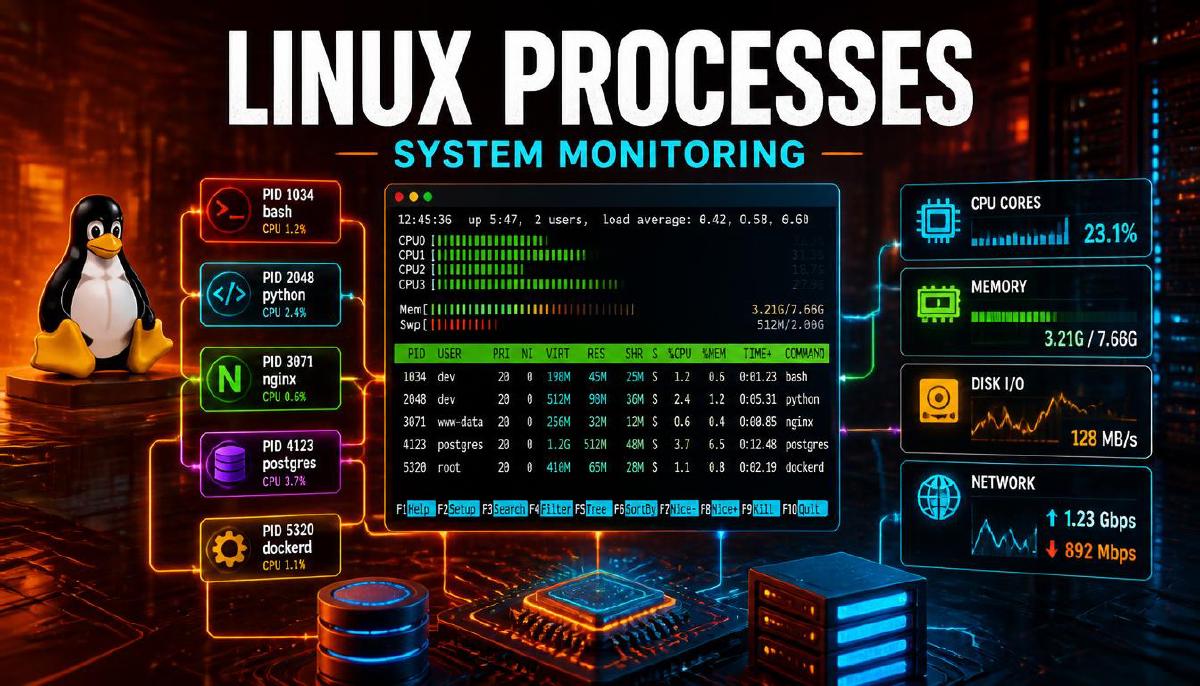
Real-Time Monitoring with top
While ps provides a snapshot, top continuously updates the process list.
Run:
topThe interface provides information about:
- System load
- CPU usage
- Memory usage
- Number of processes
- Process states
- Individual process resource consumption
A typical troubleshooting workflow might be:
Something feels slow
        ↓
Check system load
        ↓
Check CPU and memory
        ↓
Identify suspicious processes
        ↓
Investigate the process
This makes top one of the most useful first-response tools when investigating a Linux system.
htop: An Interactive Alternative
htop provides a more interactive interface for process monitoring.
htopCompared with top, it generally makes it easier to:
- Navigate through processes
- Sort processes
- Inspect resource usage
- Send signals
- Understand CPU utilization
It is not fundamentally a different process-management system. It is simply a more convenient interface for observing and interacting with processes.
The /proc Filesystem
Linux exposes a large amount of runtime information through a special virtual filesystem called:
/procUnlike a normal filesystem, /proc does not primarily contain files stored on disk.
Its contents are generated by the kernel and provide information about the running system.
For example:
ls /procYou will find many numbered directories:
/proc/1
/proc/4217
/proc/4382
These numbers correspond to process IDs.
Therefore:
/proc/<PID>contains information associated with a particular process.
For example:
cat /proc/1/statuscan provide detailed information about PID 1.
This is one of the most important ideas to understand about Linux:
The kernel exposes much of its runtime state through interfaces such as
/proc.
File Descriptors
Processes interact with the outside world through file descriptors.
The standard file descriptors are:
0 → stdin
1 → stdout
2 → stderr
You can inspect the file descriptors of a process through /proc.
For example:
ls -l /proc/<PID>/fdThis can reveal which files, devices, pipes, and sockets a process currently has open.
This becomes particularly useful when troubleshooting applications that appear to have problems with files, logs, network connections, or resource limits.
Signals and Process Management
Linux provides signals as a mechanism for communicating with processes.
For example:
kill <PID>does not necessarily mean “immediately terminate this process.”
The kill command sends a signal.
The default signal is:
SIGTERMwhich politely asks the process to terminate.
If a process does not respond, an administrator may use:
kill -9 <PID>which sends:
SIGKILLSIGKILL cannot be caught or ignored by the process and causes the kernel to terminate it.
Therefore, kill -9 should generally be a last resort rather than the default way to stop processes.
Load Average
When monitoring a Linux system, one of the first values you will encounter is the load average.
It is commonly displayed by:
uptimeor at the top of:
topYou might see:
load average: 0.42, 0.37, 0.31These values represent the system’s average load over approximately:
1 minute 5 minutes 15 minutesLoad average should not be interpreted simply as “CPU percentage.”
It represents the amount of work competing for system resources, including runnable tasks and certain tasks waiting for resources.
The number must therefore be interpreted in relation to the number of available CPU cores and the type of workload.
Monitoring Is More Than CPU Usage
One of the most important lessons in system monitoring is that CPU usage alone does not tell the whole story.
A slow system may be experiencing:
- CPU saturation
- Memory pressure
- Excessive swapping
- Disk I/O contention
- Network problems
- Too many processes
- A single malfunctioning application
Useful commands include:
uptime
free -h
ps aux
top
htop
For disk and I/O investigation, tools such as:
iostatcan provide additional information.
For network activity:
ssand tools such as:
iftopcan help identify active connections and network usage.
The goal is not to memorize every monitoring command.
The goal is to develop a systematic approach to answering:
What is the system doing right now, and which resource is limiting it?
A Practical Troubleshooting Workflow
Suppose a server suddenly becomes slow.
Instead of immediately restarting services, start by observing the system.
1. Check the overall system state
uptimeLook at the load average and how long the system has been running.
2. Check memory
free -hLook for available memory and swap activity.
3. Inspect processes
ps aux --sort=-%cpu | headThis can show processes consuming the most CPU.
Then:
ps aux --sort=-%mem | headcan help identify processes consuming the most memory.
4. Monitor continuously
topor:
htopObserve whether the problem is persistent or temporary.
5. Investigate the suspicious process
Once you have identified a process, its PID becomes the starting point for deeper investigation:
PID
 ↓
/proc/<PID>
 ↓
status / fd / cmdline / ...
 ↓
application logs
 ↓
root cause
This approach is much safer than blindly restarting services or killing processes.
Processes, Services, and Threads
It is important not to confuse these concepts.
A process is a running instance of a program.
A service is a long-running function provided by the system, often managed by systemd.
A thread is an execution unit within a process.
For example:
systemd
   │
   ├── sshd process
   │      ├── thread
   │      └── thread
   │
   └── nginx process
          ├── thread
          └── thread
The exact relationship varies depending on the application architecture, but the distinction is important when moving from basic Linux administration toward deeper system and performance analysis.
Why Processes Matter in DevOps
Process management is not an isolated Linux topic.
It appears throughout infrastructure and DevOps work.
When you:
- manage a Linux server,
- troubleshoot a failed application,
- configure a container,
- investigate high CPU usage,
- diagnose memory problems,
- inspect a system service,
- or analyze application performance,
you are ultimately interacting with processes and the resources they consume.
Containers make this relationship even more important.
A container does not contain a completely independent kernel. Processes running inside containers are still managed by the host Linux kernel, with isolation and resource controls applied around them.
Understanding Linux processes therefore provides a foundation for understanding containers, orchestration, and eventually Kubernetes.
The Bigger Picture
At this point, several concepts we have covered begin to connect:
Firmware
   ↓
UEFI / BIOS
   ↓
Bootloader
   ↓
Linux Kernel
   ↓
initramfs
   ↓
PID 1 / systemd
   ↓
Services
   ↓
Processes
   ↓
Threads
   ↓
CPU / Memory / I/O / Network
This is the transition from booting Linux to running Linux.
The kernel initializes the system, PID 1 establishes the user-space environment, services are started, and processes begin consuming system resources.
System monitoring gives us the tools to observe what happens after the system is up and running.
Key Takeaways
- A process is a running instance of a program.
- Every process has a unique PID.
- Processes form parent-child relationships and create a process tree.
- On modern systemd-based Linux systems, PID 1 is normally
systemd. - Processes can be running, sleeping, stopped, or in other states.
- The Linux scheduler determines which runnable processes receive CPU time.
/procexposes runtime information provided by the kernel.psprovides a snapshot of running processes.topandhtopprovide continuous process monitoring.killsends signals to processes; it does not inherently mean “force kill.”- Load average must be interpreted relative to the available CPU resources and workload.
- Effective troubleshooting requires looking at CPU, memory, I/O, and network—not just one metric.
- Understanding processes provides an important foundation for containers and broader DevOps concepts.
What’s Next?
Processes explain what is running on a Linux system.
The next step is to understand who is allowed to do what.